w2kplot
A post-processing library for DFT calculations in Wien2k
w2kplot is a Matplotlib wrapper written in Python to create publication quality plots from data generated from the WIEN2k density-functional theory (DFT) code.
Examples
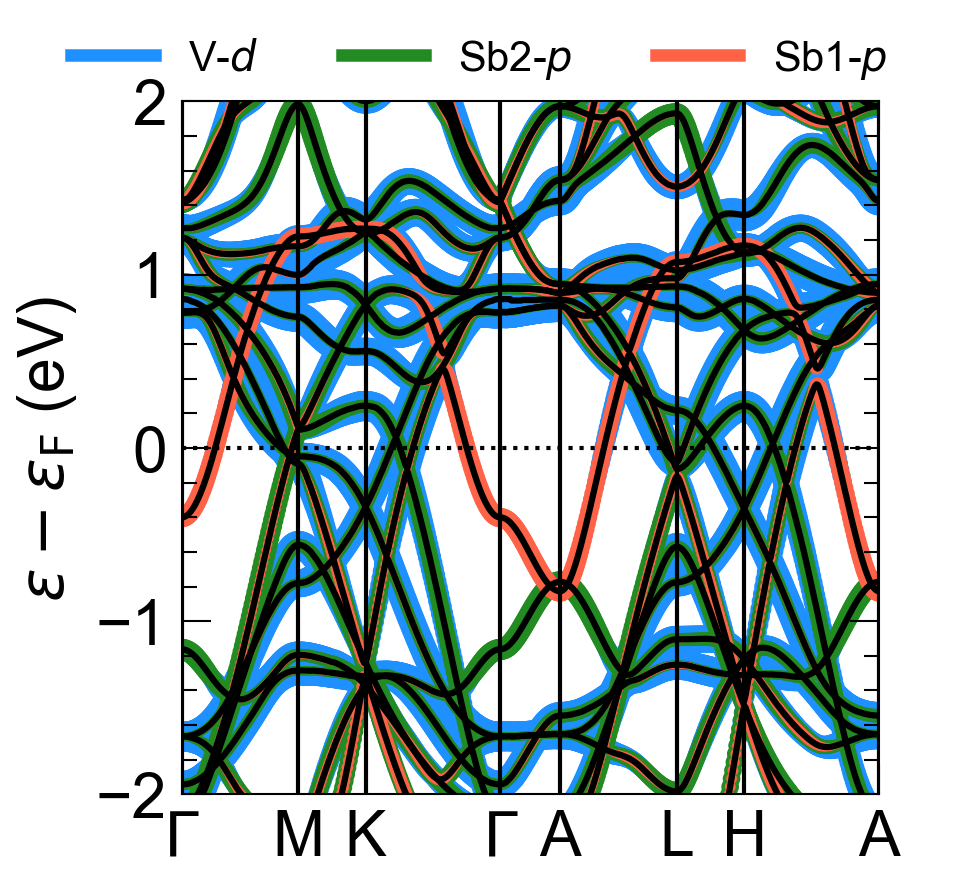
Here’s example of plotting the orbital character on top of the bands a.k.a, a fatband plot.

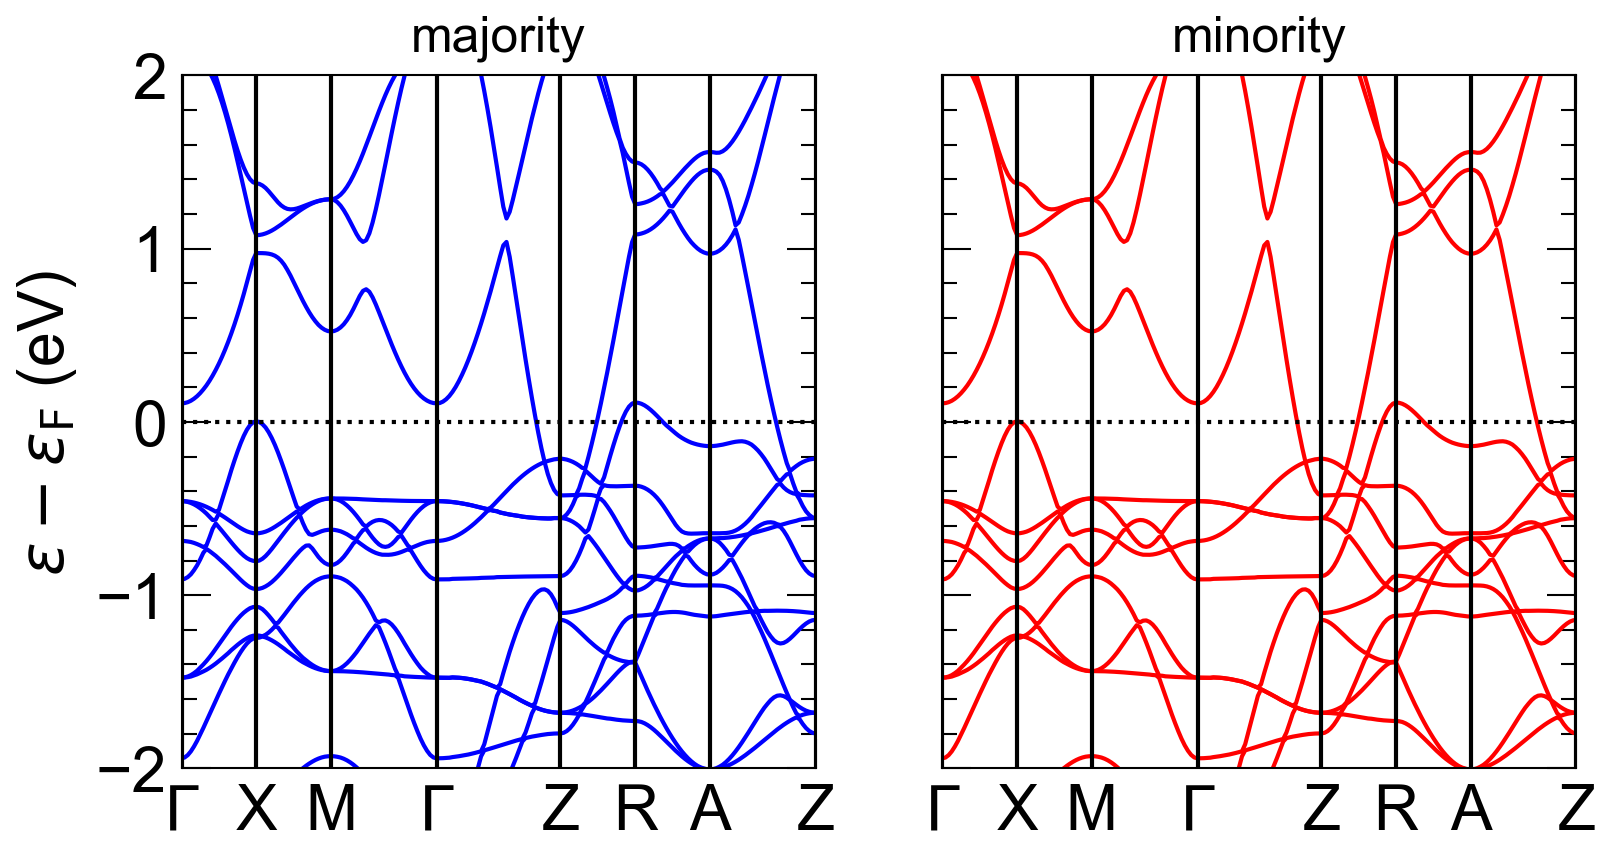
We can easily create subplots with different band structure files.

The API is extremely intuitive and should feel familiar to the matplotlib API. Here’s a quick example to create a band structure plot.
	# plot basic band structure
	from w2kplot.bands import Bands, band_plot

	plt.figure()
	dft_bands = Bands(spaghetti='case.spaghetti_ene', klist_band='case.klist_band')
	band_plot(dft_bands, 'k-', lw=1.5)
	plt.show()
w2kplot has a command line interface (cli) for quickly viewing results and testing. A band structure can be plotted from the case directory by executing w2kplot-bands. Similarily, the orbital character (“fatbands”) can be generated from w2kplot-fatbands. The entire list of options that allow you to drive these two tools are shown below.